
You may have noticed ambient air quality returning to centre stage globally as a hot topic of discussion and debate. While the media coverage has helped draw attention to this critical issue, the plethora of data and views can cause confusion and can delay much-needed action. In this article, I will start with recent examples of air pollution stories that have grabbed international headlines, highlighting discrepancies and drawing some conclusions. I will then discuss key policy implications and priorities.
Global rankings
A number of global rankings were released this year relating to air quality. The ranking that probably received most attention, particularly in the Middle East, was the World Bank’s Little Green Data Book 2015. For the past 15 years, this report has presented data on economic, environmental and public health issues. This year, the report replaced its 2014 indicator on urban PM2.5 [i] levels with two indicators describing PM2.5 exposure on a national level.
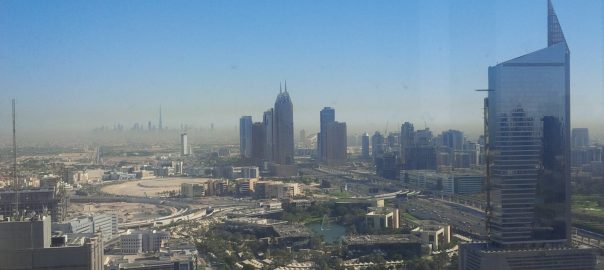
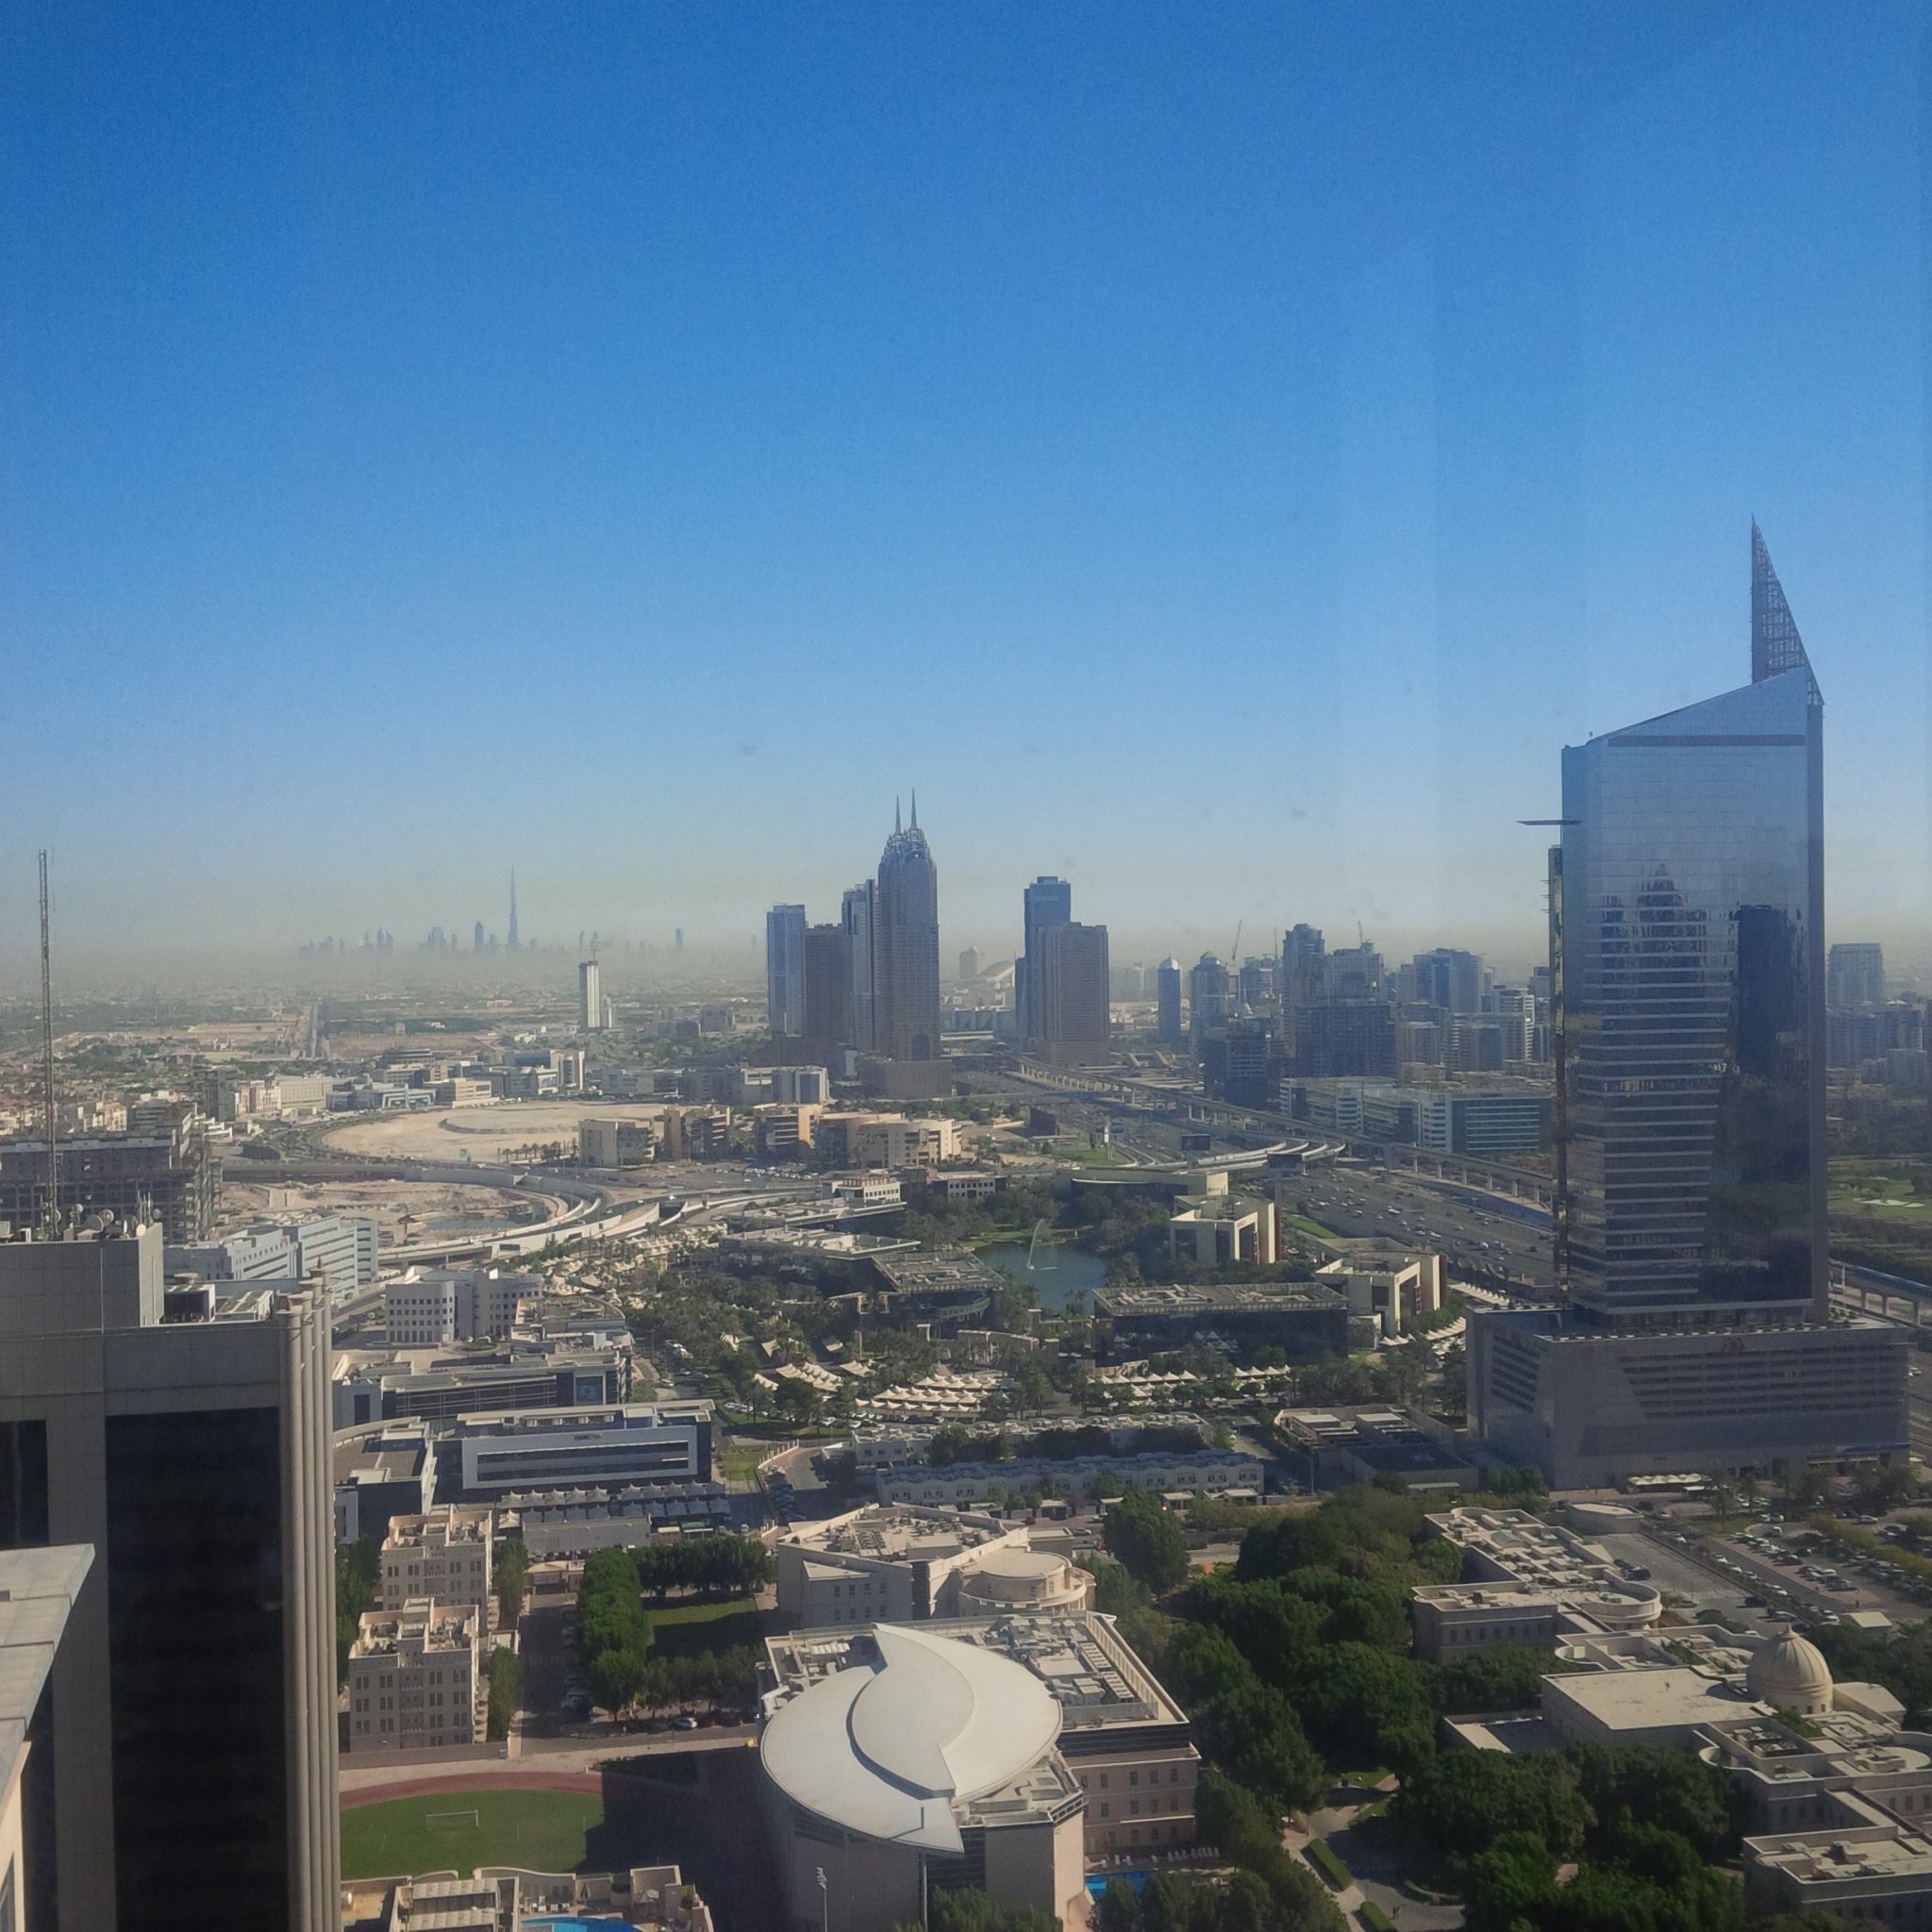
The surprising result was that the country with the worst performance was not China or India, but the United Arab Emirates. China was not far behind, but India was at less than half the average national exposure level of the UAE. The UAE’s response was to focus on the naturally-occurring high levels of PM2.5 due to the country and region’s desert environment. This is true, of course, but it is only part of the issue—studies have shown that a significant proportion of PM2.5 in the UAE is from anthropogenic (man-made) sources [ii].
Within a few weeks, the World Health Organisation published its latest data on PM2.5 at a city level. Ten out of the worst 15 performing cities were in India (including the worst four), and the rest were in Pakistan, Iran and Qatar. Not a single city of the worst 15 performers was in the UAE, China, or in the rest of the world, for that matter.
As a final example, the Environmental Performance Index team at Yale published a world map illustrating results of satellite-based PM2.5 analysis at a neighbourhood level (10-by-10 kilometer square). Areas with the highest concentration of PM2.5 include eastern China, northern India, Pakistan and large parts of the Middle East and Africa. Large parts of Europe, the east coast of the United States, Japan, central Australia and Mexico are in the very high PM2.5 range as well.
What’s going on?
How can the results of these analyses be so different, and how can policy makers and planners use the data effectively?
It is obvious that the studies are based on different data sets. The World Bank PM data was provided by the Institute for Health Metrics and Evaluation at the University of Washington. The World Bank report states that data is for 2010; however, the Economist’s article on the matter implies that some of the data is a decade old, and that the data collection and analysis methodologies are not entirely robust and are based on a mix of measured and estimated data. Regardless of the date or accuracy of the original data sources, what stands out about this study is the national-averaging methodology used, which masks the poor performance of polluted urban centers, particularly in countries with large rural areas.
The WHO study is more transparent, with the entire data set being available online at both a country and city level. Further, the data set clearly indicates measurement years (typically 2008 – 2012) and whether a data point is an actual measurement or an estimation.
The EPI data map is particularly interesting, as it shows EPI-generated satellite data averaged at both a neighborhood and national level. This is an improvement over the 2014 EPI map, which showed satellite-based data at a national level only. Contrasting the national and neighborhood level views makes it clear how poor the national-level indicator is, particularly for geographically large countries such as China, Russia and the U.S. The Yale team has also provided a clear and user-friendly guide explaining the significance of PM2.5, the data sources used, and the analysis undertaken. In addition, the map’s creators acknowledge that even neighbourhood-level satellite data is an average, and that ground-level monitoring is required, particularly for high-risk neighbourhoods.
It is interesting to note that all three data sets rely solely on PM2.5 as an indicator for outdoor air pollution. This is a testimony to the large body of scientific evidence on the adverse impacts of PM2.5. At the same time, it poses the risk of ignoring other significant pollutants (see below). Additionally, it is important to keep in mind that PM2.5 originates from a wide-range of sources, both anthropogenic and natural. As such, while the global measurement figures may be comparable in one sense, an understanding of PM2.5 composition is required to allow a more informed comparison across cities, countries and regions.
Europe
Moving beyond global reporting, it is worth highlighting some of the recent region-specific air pollution stories. These offer a finer grain of detail compared to the global data, particularly in relation to the success and challenges of policy interventions at a regional and city level.
The EU, generally regarded as a leader in environmental policy and implementation, is on the path towards more stringent air quality standards. These were approved by the European Parliament a few weeks ago (October 2015) and are now awaiting endorsement by member states. The new limits would allow the EU to halve the number of premature deaths from air pollution, which currently claims 400,000 lives per year.

Some of the 28 member states are already having trouble meeting the current, more relaxed standards. However, the existence of the legally binding EU laws has allowed a group of environmental lawyers to take the U.K. government to court for breaching EU nitrogen dioxide (NO2) limits. The campaigners secured a major victory, with the court ruling in their favour and requiring the U.K. Environment Department to draft new plans by December 2015 that would demonstrate EU limits being met prior to 2030 Interestingly, the quote from the chief executive of the Society of Motor Manufacturers and Traders defends diesel vehicles as being the “cleanest ever,” a myth we do not have to spend much time debating after the recent Volkswagen scandal.
If the U.K., and other EU countries, are looking to implement low-emission-zones (LEZ), then the results of the London LEZ policy should be kept in mind. Disappointingly, a recent scientific study has shown that the London LEZ has had zero effect in reducing air-quality related health impacts on school children. The LEZ was introduced in 2008 to address the air quality issue specifically, after the congestion charge failed to do so. In analysing the reasons behind the results, the authors of the study point to the larger proportion of diesel vehicles in the fleet and the inaccuracy of the EU diesel tests. In short, the London LEZ did not do enough to address the impact of diesel vehicles.
Paris’s mayor seems to be on the right track: she has publicly committed to ban diesel cars from Paris by 2020. This is definitely a development worth watching.
China
A recent story on blue skies in Beijing makes a very clear point: we know how to address air pollution in cities. To help ensure a successful national celebration, authorities in Beijing banned half of the city’s cars from the streets two weeks in advance and temporarily closed hundreds of factories. On the day of the event, 40,000 construction sites were ordered to close. The result: clear skies and a 73 percent reduction in PM. In this case, drastic measures had to be temporarily applied to produce drastic improvements. The challenge is in making this approach the business-as-usual scenario.
In addition to all-year-round transport and industry-related emissions, China has to face the issue of coal-based heat generation in the winter. There are cities in China that have reported PM2.5 levels over 50 times higher than the recommended level set by WHO. In response, Beijing’s mayor has committed to a series of coal power plant closures.
So what?
As a start, let us remind ourselves of the figures published by WHO last year: air pollution is responsible for over 7 million deaths a year. Out of those, around 3.7 million are due to outdoor air pollution. So, ambient air pollution and its detrimental health impacts are a reality. And we are almost certainly underestimating the negative health impacts, as these figures are based on the impacts of only some of the known pollutants (e.g. PM2.5). Moreover, there are additional health impacts to consider beyond mortality, such as respiratory infections. While the majority of the deaths are in developing countries, air pollution is still a serious issue in the developed world. For example, in the U.K. it is estimated that early deaths from air pollution are higher than those from obesity and alcohol combined.
Let us also remind ourselves that, as a human race, we have previously won the battle against air pollution. In cities such as London and Dublin, where pollution was primarily linked to coal, banning the use of coal in cities has helped us get rid of the visible, short-term black carbon smog. Even in the case of non-coal-related (photochemical) smog in Los Angeles and the wider area of Southern California, improved emission standards and other policy interventions over the past two decades have significantly improved both the air quality and the health of residents. This collective experience has left us with a wealth of knowledge on managing air quality—it is a science that we understand well. At least, the scientists and experts do.
Today, some cities, such as Beijing and Krakow, are still struggling with air pollution impacts of coal burning. Other cities have the challenge of addressing air pollution from transport, industry, agriculture or natural dust. In the vast majority of instances, pollution results as a combination of these sources in varying proportions. Moreover, this pollution is often not generated within the city’s limit, or even within the country’s borders.
Where does this leave us?
- Measure: given the evidence on the serious health risks of air pollution and the technology and information available today, there is no excuse for not understanding a city’s air quality performance. Air quality experts can advise on the most suitable indicators to measure and the most appropriate analytical and modeling tools to utilize. With global-satellite modeling data becoming widely accessible through global ranking studies, there is little room for hiding our heads in the sand. Ground-based measurements are still needed to set context-specific standards and to monitor compliance with them.
- Address root causes: understanding the root causes will help us to develop and implement effective interventions at a national, regional and city level. In drastic situations, these may need to be equally drastic interventions, such as banning use of all or some vehicles in certain locations or at certain times. Particular focus should be placed on improving air quality where people live. Mitigation and compensation measures (e.g. planting trees, moving residents away from motorways) should be a last resort and not a primary strategy.
- Raise awareness: the World Resources Institute is campaigning for better access to environmental information for the general public They report that 53 percent of countries in the world do not report urban outdoor air pollution information. I strongly believe that people have a right to know when air quality conditions are unsafe in their neighbourhoods, to allow them to plan their activities accordingly and take the necessary precautions. Organizations such as Clean Air London have done a tremendous job of cutting through the myths and jargon to bring a clear and compelling argument for addressing air pollution to both the public and the politicians. One Atmosphere is a recent video they produced as part of these efforts, and it provides a good example of effective communication.
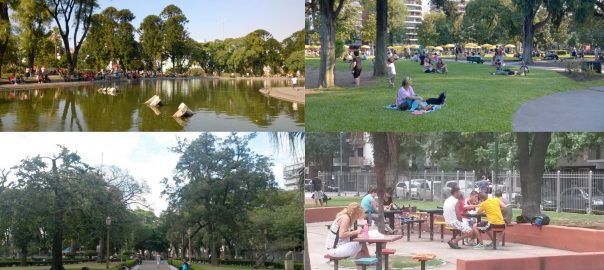
The recent trend towards healthy, liveable cities has helped bring air pollution back to the spotlight in many regions around the world. It is a global issue with many local flavours—one which we have successfully addressed before and which we cannot afford to ignore now.
Huda Shaka
Dubai
About the Writer:
Huda Shaka
Huda's experience and training combine urban planning, sustainable development and public health. She is a chartered town planner (MRTPI) and a chartered environmentalist (CEnv) with over 15 years' experience focused on visionary master plans and city plans across the Arabian Gulf. She is passionate about influencing Arab cities towards sustainable development.


We need to be more concious about air pollution, especially about the one product by cars. It’s important to change our point of view and focus on how decrease the amount of exhaust gases in the air. It is time to promote sustainable mobility!