In a previous article I proposed that we adopt a perspective on preservation that allowed for transformation and change of what is to be preserved. This type of change has a more precise definition: iteration. To iterate means to “cover the same ground twice”, using feedback from the result of previous attempts and from environmental change to improve the result. In this article I mean to demonstrate how the phenomenon of iteration creates complexity and explains the form of our cities, how it relates them to the morphology of nature, and how to use it to reshape the cities we inherited from the static, final plans of 20th century modernist design.
Complex things can have very simple foundations. Natural world morphology and even pure abstract ideas like mathematics are full of very simple iterations—repeated fractals—that rely on the impact of time and the abundant data of physical matter to produce very complex forms.
How complexity is made
Fractal geometry has infiltrated popular culture since it was formalized in the early 80’s from the works of Benoit Mandelbrot. While it has been used mathematically to study the form of cities by researchers such as Pierre Frankhauser and Michael Batty, the insights to be drawn from this research have not yet penetrated the field of practical urbanism, defined as the construction of cities. Connecting the fractal city by Nikos Salingaros approaches the topic by asking what type of city is fractal, without going into depth as to how a fractal is made. Christopher Alexander, in The Nature of Order: The Process of Creating Life, begins to develop profound ideas on the topic.
Part 2 in this two part series can be found here.
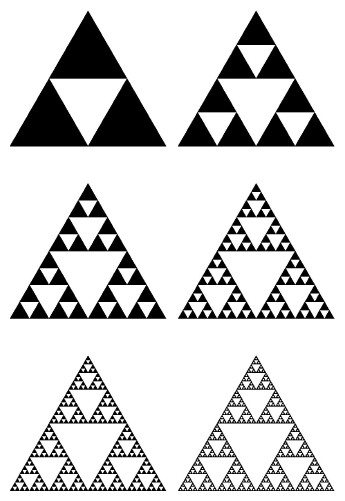
At each step we use the results of the previous step and repeat some procedure, in this case either adding two copies of the previous object below the current one (composition) or replacing the three large triangles each by a copy of the whole object (decomposition). Both approaches will generate the Sierpinski triangle over an infinite number of repetitions.
It is generation and infinity that make fractal geometry so different from euclidean geometry, which can be drawn instantaneously and linearly. Because fractal geometry is recursive, it is in theory infinitely complex, and the only way to see what a fractal object will look like is to run the computation that generates it until we grow tired of watching the process unfold.
Objects substituting themselves for copies of themselves are all around us. It is the basic process that underlies all living things. In a living system a starting point, the embryo, contains a program, DNA, that will be multiplied into trillions of cells. The cells follow the transformations described by their DNA codes by taking certain actions depending on their environmental factors and previous states. Christopher Alexander uses the example of a bone, whose shape evenly distributes structural stress across its surface, by claiming that the form of a bone emerges from a program telling cells to add bone mass where the stress is most intense. It is physical and structural feedback that shapes the bone.
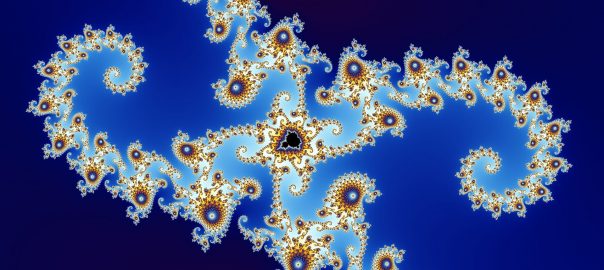
Benoit Mandelbrot wrote The Fractal Geometry of Nature, a book that pretty much started the fractal revolution by providing a mathematical framework for understanding real physical space. He also used fractals to describe the movement of stock prices. In his honor, a mathematician named a curious mathematical object the Mandelbrot set, which you are likely to have heard of or seen before.
The algorithm that generates the Mandelbrot set is extremely simple (https://en.wikipedia.org/wiki/Mandelbrot_set):
For given coordinates in the plane made up of the normal and complex numbers (basically an x and y graph, where y is that funny number i, the square root of -1), each coordinate sum will either spin forever in the orbit of radius 2, or escape after a determined number of iterations. The coordinates which never escape are defined as being part of the set, but they are actually not that interesting. What is interesting is what happens when we count iterations and use the results to color the graph.
If, each time we throw out a pair of coordinates (absolute value bigger than 2 at any iteration), we assign to it a number equivalent to the number of iterations it took to figure out it didn’t belong in the set, we will form groups of iteration equivalence. And once we apply a single, shared transformation (a “DNA code” for the chaotic equation) to these sets, in this case defining a specific color for each iteration that threw out some coordinates, applying this color to these coordinates while drawing the Mandelbrot set, we will generate this kind of geometry:
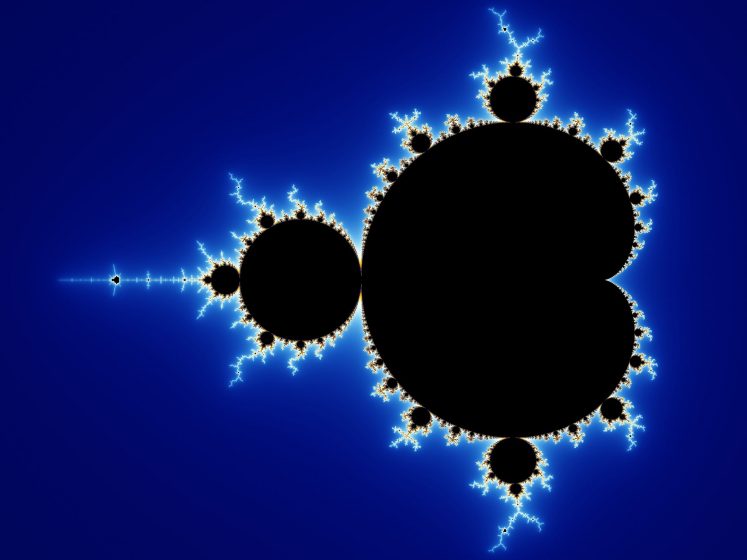
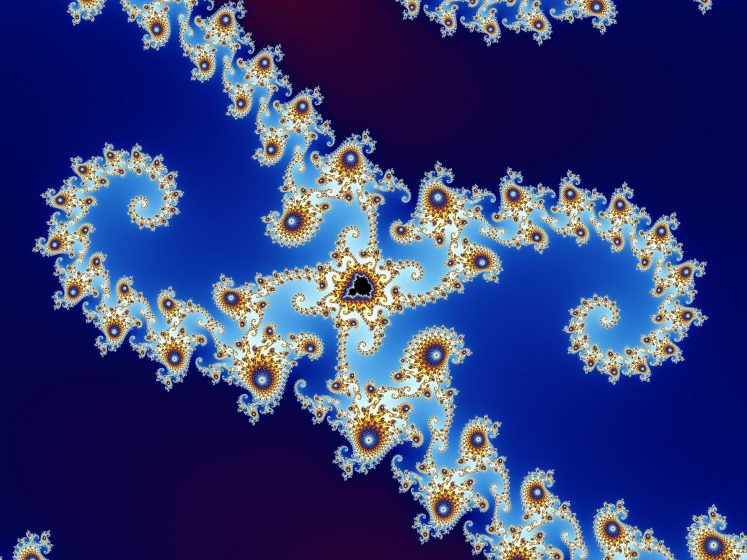
The construction of the Mandelbrot set pictures is a fascinating exercise in computer art, especially since it is so simple but generates practically infinite geometry (the computer eventually runs out of cycles calculating all those iterations at the edge of the set, but a stronger computer can always go deeper).
But before we start thinking that this is only a weird property of iterating over complex numbers, we can simplify the generation of fractals even further. Let’s not complicate things with two dimensions and color. Let’s have only one dimension (a line) and show each succeeding iteration as another line.
Stephen Wolfram wanted to figure out what could happen if he tried every possible combination of the most simple program he could imagine. This is one combination of the program, which he called Rule 30 (or 00011110):
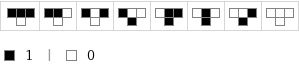 This diagram describes the following computation: for each row, observe the cells from the left, middle and right neighbor of the previous row, and select the matching color in the rules.
This is the output of running the program, line-by-line:
Here is what happens when the rule changes from 30 (00011110) to 90 (01011010):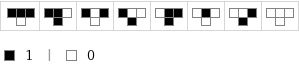
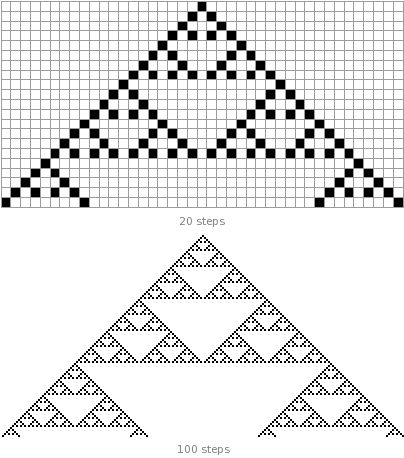
We get the Sierpinski triangle.
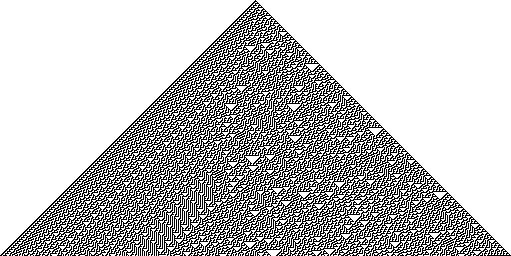
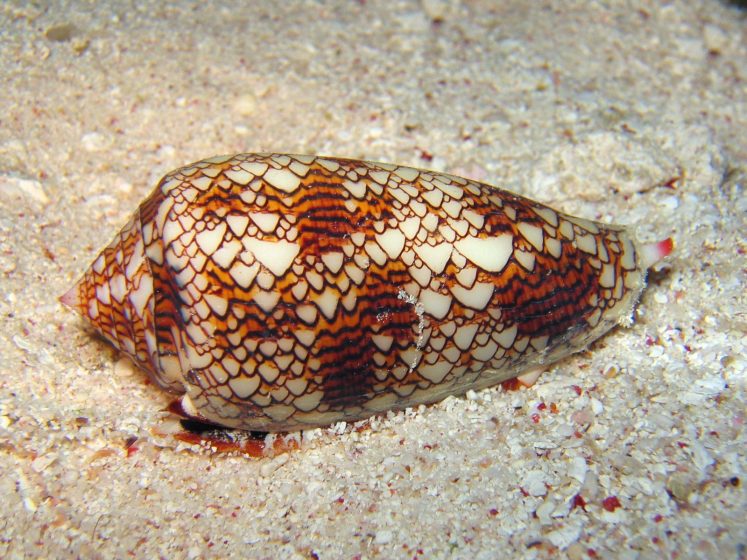
And surprisingly, this pattern shows up in the natural world, as a one-dimensional seashell generation pattern, with deep implications for the theory of natural selection.
These discoveries led Wolfram to write A New Kind of Science, inviting scientists to study pure computations as a model for understanding the physical world. What we should learn from it is that natural world morphology and even pure abstract ideas like mathematics are full of very simple iterations that rely on the impact of time and the abundant data of physical matter to produce very complex forms. Once we start looking at things through the lens of iteration, we start to see how they might have started very simply and been generated.
Geometric depth from the iteration of technologies
I don’t believe that there is a strict separation between a supposedly modern and traditional architecture. Instead there exist different geometric processes, and while traditionally builders have employed nesting and fractal processes in their work, for perhaps no other reason than that it came naturally to them, modern builders have restricted themselves to linear geometric processes due to drawing their inspiration from Cartesian science and engineering. They then created tools, such as drafting tables and computer-aided design software (drafting tables with an undo button) to make linear processes more efficient.
There are only so many tricks that one can perform with linear geometry, although computers have extended the reach of those tricks. But the confusion of modern architects becomes even more obvious when they ascribe artistic merits to traditional builders who never aspired to be artists at all. One such instance is the introduction by present-day star architect Jean Nouvel of a biography of the 18th century French military engineer Vauban. Nouvel describes Vauban’s fortresses as an early form of land-art and morphing, then asks: could a man be an artist without being aware of it?
Vauban was not an artist at all. Military necessity led him to employ geometric processes that significantly increased the complexity of fortifications, and it is incidental that today we find his projects to have artistic merits. The process through which Vauban’s work became worthy of architectural praise provides the key to the distinction between linear and complex geometry, and the process of iteration of new technologies. We see in the construction of star forts the impact of evolving technology and obsolescence on the landscape of cities. That it had no aesthetic purpose makes it even more interesting.
Vauban was not the inventor of the star fort. Those had been around for more than a century when he began his career for the army of Louis XIV. The basic star fort was a simple concept: the old masonry walls with towers of the medieval age had shown themselves obsolete with the advent of cannons, and they had been replaced with thick banks of earth dug out of trenches. The major flaw of this design, it was soon discovered, was to provide space out of reach of defensive fire at its corners. In the first iteration of the design, the corners were extended into diamond-shaped turrets, introducing a first level of nesting geometry and beginning the genesis of a fractal.
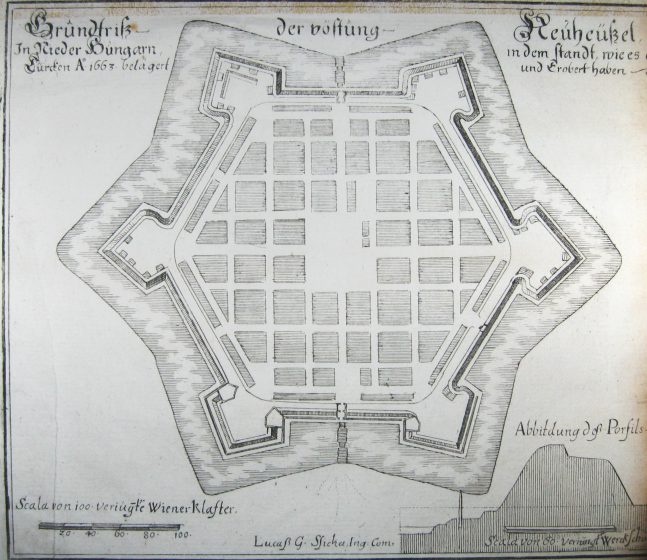
While the star fort was successful at resisting attacks, it was not impregnable. A method was eventually devised to capture them by digging trenches in zig-zagging patterns through which troops could assault the walls without being exposed to cannon fire. In fact this is how Vauban built his career, and some of his “plans” for besieging star forts are significan military engineering projects of their own..
Military engineers kept improving on the star fort technology’s effectiveness by correcting their vulnerabilities. And so, iteration by iteration, the geometric depth of the star fort concept increased.
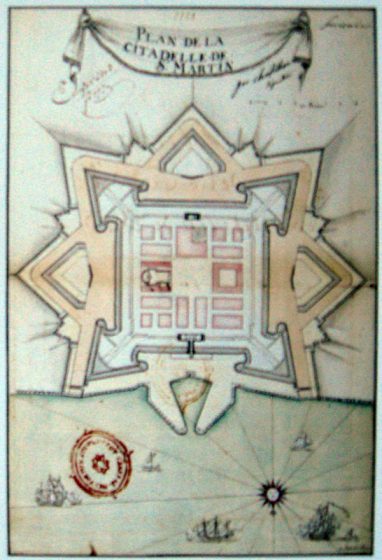
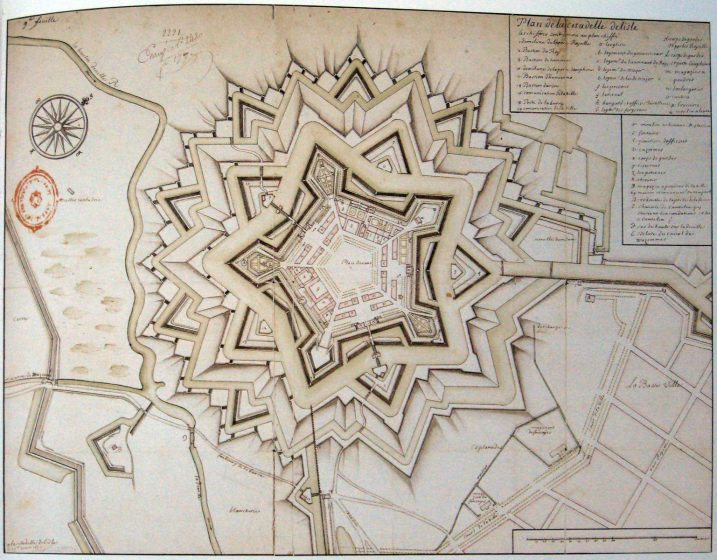
Vauban’s supposedly great invention was nothing more than repeating this process of increasing geometric complexity by iterating again and again, ultimately creating what many now consider to be his masterpiece, the Citadel of Lille, a showcase of complex geometry made from the refinement produced by centuries of iteration of the star fort concept.
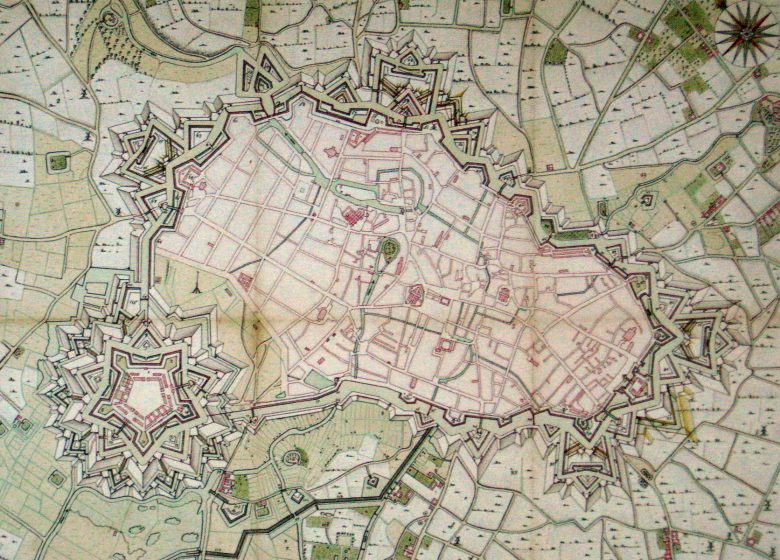
It is important to note that the Vauban extensions to star fortifications did not mean that the simple early star fort became obsolete. In fact many simple star forts were built in the 18th and 19th century in America as the military threat was low and simple forts much cheaper to build. The difference between a simple fort and Vauban’s complex fort is one of depth and effectiveness, not technology, and there is a real cost-benefit choice to make. The star fort only became completely obsolete when the concrete bunker replaced it, and the early bunkers reset the process of complex geometry generation to its starting point by being simple concrete shells.
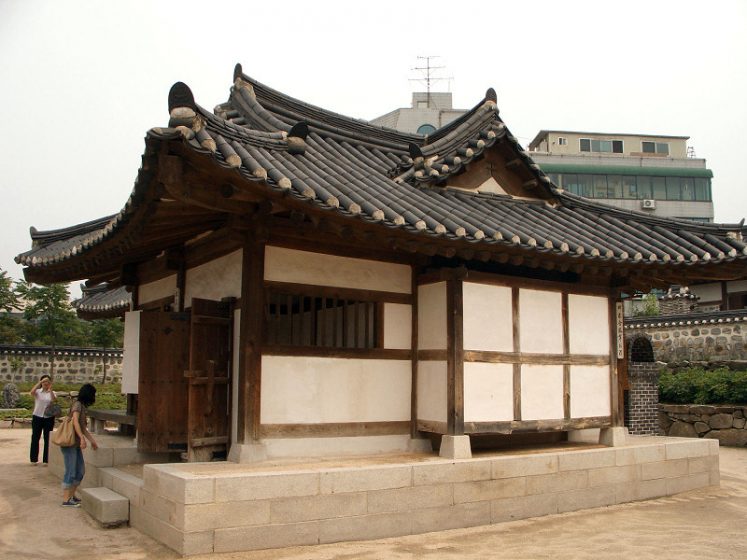
When we seek to create symmetry in an urban environment, we want buildings to be as alike as possible while allowing for adaptation to context. If we understand geometric depth we can build in such a way that poor and expensive buildings have the same basic design in their first levels of geometry, but expensive buildings have many more scales of geometry nested within that basic design. It is not necessary for an entire city to be made of the same materials, for instance. Materials are one of the last visible scales of geometry, and so we can have a city of mud bricks and marble buildings that nevertheless share 95% of their geometry and beautifully complement each other to create an emergent structure, while both poor and rich citizens have a home adapted to their situation.
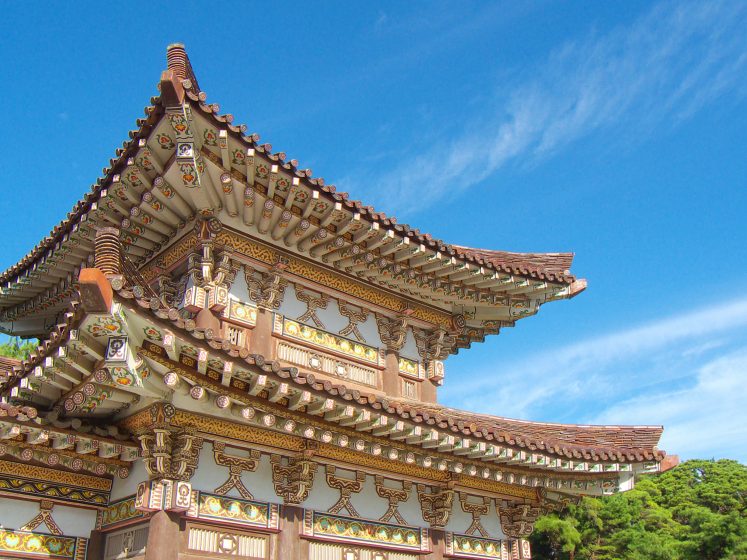
We can look at these examples from Korean traditional architecture for an illustration. The first image (below) is a simple house and the second is the tomb of a great king. Both buildings use the same design, but the building on the right has much greater depth in this design.
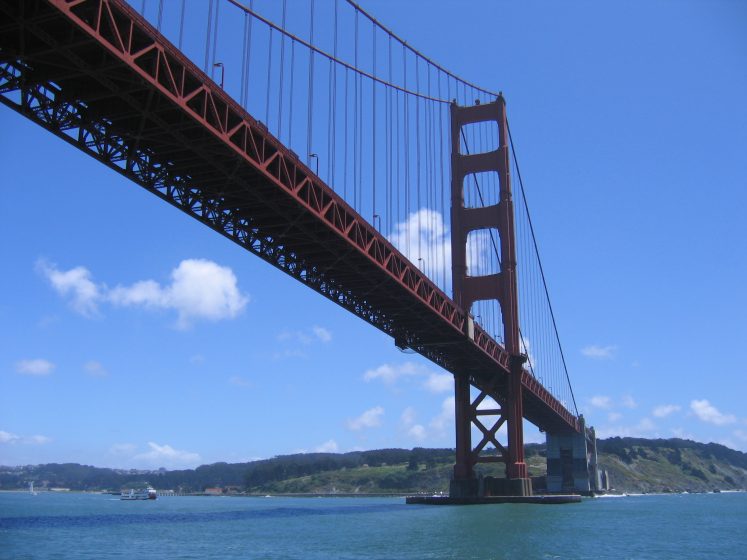
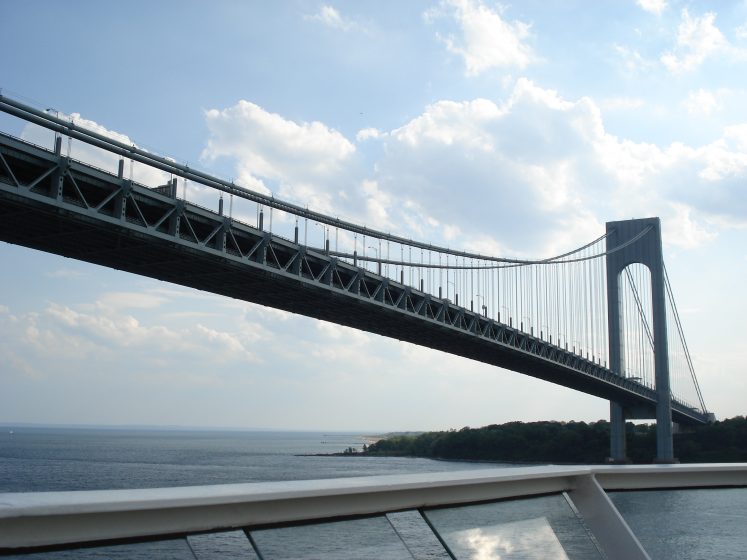
Another interesting comparison is between the Golden Gate bridge in San Francisco and the Verrazano Narrows bridge in New York.
The bridges start off from the same technology, but the Golden Gate bridge develops into more depth and detail within this foundational design, and is for this reason the more famous of the two bridges. That doesn’t mean the Verrazano Narrows bridge isn’t beautiful on its own.
And to make things as simple as they can get, we can compare a Sierpinski triangle with four levels of iteration with one that has six levels.
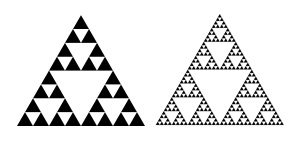
The framework of analysis presented here gives us a very powerful instrument through which to understand the shapes of buildings and open spaces of cities and measure their complexity. It does not, however, sufficiently explain what can make a city appear to be a natural object over greater scales.
I will cover another aspect of iteration, one that occurs in a sequence of fractal objects growing together in an ecosystem, in a following article.
Mathieu Hélie
Montréal

Leave a Reply