With citizen-generated maps and diagrams based on real-life conditions and structured around a holistic framework, the patterns that emerge allow for both residents and planners to ask questions that can lead to both local and regional ecological improvements.
While figuring out the intricacies of our own body’s metabolism is no simple feat, doing a holistic assessment of something as complex as a modern industrial city, with all its physical and cultural microcosms, can seem daunting. However, if we look at cities through a metabolic lens, just as we do for our bodies, a framework through which to successfully model urban systems flows comes into focus. Urban metabolism, used to analyze how urban areas function with regard to resource use and underlying infrastructures, helps us understand the relationship between human activities and the natural environment.
https://youtu.be/uu-a1hFEV7Q
Applied urban metabolism
Urban metabolism as a concept is not entirely new. As far back as the 19th century, Karl Marx and Friedrich Engels recognized that human activity alters the biophysical processes by analyzing the dynamic internal relationships between humans and nature. It wasn’t until over a hundred years later that a more holistic assessment of a city’s anatomy was formally developed for the first time. In a 2007 paper entitled “The Changing Metabolism of Cities“, Christopher Kennedy and a team of civil engineers from the University of Toronto defined urban metabolism as “the sum total of the technical and socio-economic process that occur in cities, resulting in growth, production of energy and elimination of waste”.
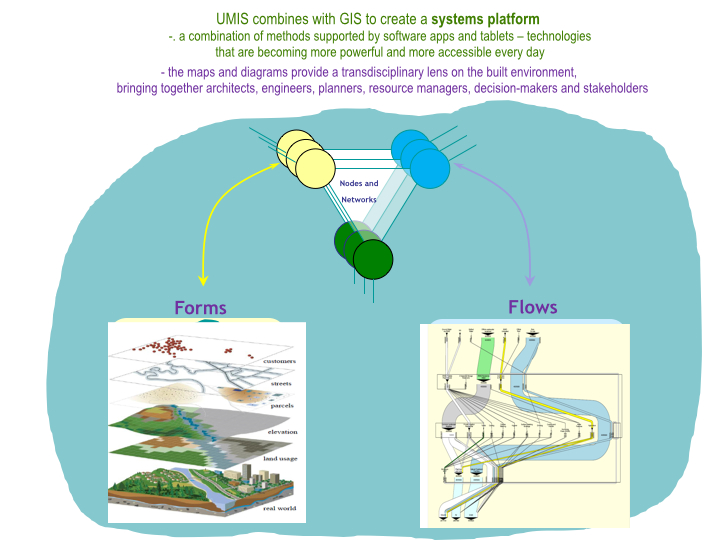
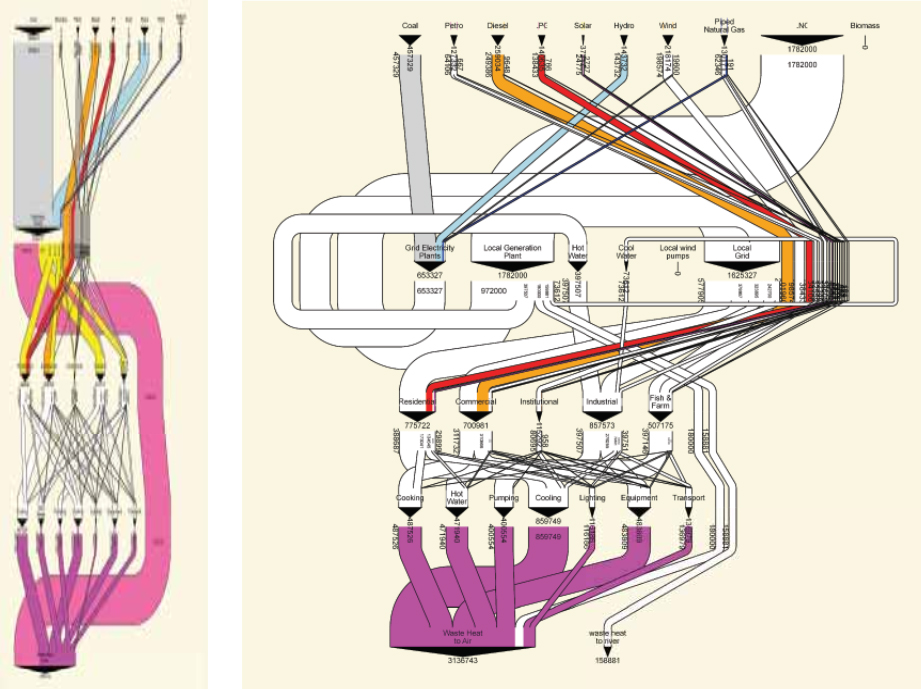
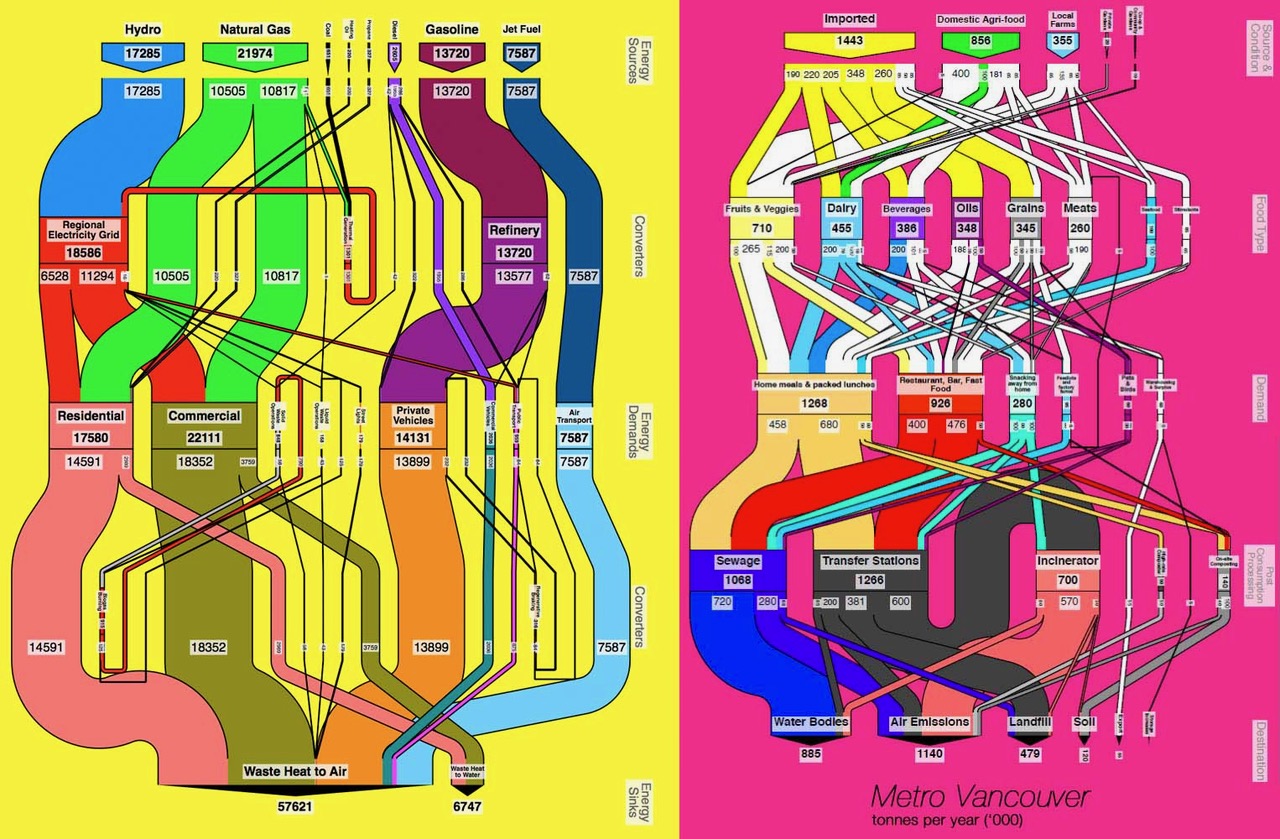
According to Dr. Moffatt, these diagrams are worth a thousand pie charts. But what if we could drill even deeper into the metabolism of a city by looking at the resource flows through each neighborhood? The fact that currently flow diagrams for most cities in the world would look similar to Vancouver’s—linear and centralized, leaving little room for localized and adaptable ways to make better use of both natural and human resources—shows that there’s a real need for tools that enable communities to better understand their own neighborhoods and identify the areas where more looping and cascading could be applied as systems become more ecological.
Participatory urban metabolism
Enter a methodology designed to empower citizens to map out their own neighborhoods and become participants in transforming their communities into more resilient, equitable, and ecologically healthy settlements: Participatory Urban Metabolism. This approach brings an increased focus on moving from a top-down to a bottom-up approach to urban environmental accounting, in order to capture data that is unavailable in conventional databases while promoting a transdisciplinary approach in which co-design takes place with society and not for society, and to ensure assessment is not a one-off event.
First piloted through Ecocity Builders’ Urbinsight Global Data Initiative in Cairo and Casablanca, the model has most recently been successfully implemented in Cusco, Peru, and Medellín, Colombia. Commissioned by the U.S. Office of the Geographer’s Secondary Cities (2C) initiative and profiled in a blog and video series as part of UN Environment’s Global Initiative for Resource Efficient Cities initiative, these two showcases offer real world examples of how urban metabolism tools and methods can be utilized by managers and practitioners to transition their cities towards more resilience and resource efficiency. To wit, based on the outcomes of Cusco and Medellín’s participatory urban metabolism assessments, city government, local universities, and community groups in those cities are now working together to develop Neighborhood Sustainability Plans.
Cusco: a participatory approach to urban metabolism
Focused on the metropolitan area in and around the city of Cusco, in southern Peru, local citizens, city officials, and student researchers from Universidad Alas Peruanas have been engaged in a multi-faceted and multiple-phase participatory action approach to urban environmental accounting since 2016. The city’s historic inner city neighborhoods, where several small study areas are located, have increasingly been feeling the need for this kind of in-depth accounting of conditions on the ground in order to find and implement a holistic solution to their garbage problem.
Participants consisting of faculty, students, local officials, architects, and planners were first introduced to the technical, community engagement, and planning processes at the core of the participatory urban metabolism method during EcoCompass workshops conducted by Ecocity Builders’ on-the-ground implementation team. After learning the ins and outs of creating a dynamic mapping platform that visualizes multiple data types, they went on neighborhood scoping trips before holding a roundtable with community leaders, who laid out the changes they wanted to see in their neighborhoods: better management of waste, a cleaner environment, and healthier food.
Based on these needs, student teams went on to conduct neighborhood material audits. They collected consumption and waste data from residents, who participated by sorting their solid waste, weighing materials by type, and analyzing composites. The team then created detailed views of neighborhood archetypes of the historic districts, which gives important insights into solutions for neighborhoods with similar characteristics and challenges. With almost 50% of household waste turning out to be organic, the team decided to research methods of constructing home composting modules, which they ultimately co-designed with the help of community members and piloted throughout four communities in the homes of participating neighbors.
The neighborhood metabolism diagrams that were created to visualize the collected data have become conversation pieces that help the community as well as city planners make informed decisions about how to redirect the flows from linear to circular. Community members found that in order to understand urban metabolism it is necessary to understand the origin of resource flows, their distribution within the city, and how the resources are being used. These insights empower people to create informed change in their unique urban contexts, which is currently being enshrined in the city’s DNA as part of the project’s next phase: the creation of Neighborhood Sustainability Plans.
Medellín: Co-creating more robust urban knowledge systems
In February 2013, the Urban Land Institute chose Medellín as the most innovative city in the world due to its advances in politics, education, and social development. Although Medellín has been crowned Most Innovative City and sets an example for urban planning to the world at large, the city is still challenged by harsh economic disparity. Wealth mainly clusters around the city center and decreases exponentially into the surrounding hills.
In Phase I of Ecocity Builders/2C Medellín, local planners, utilities, academics, and local non-profits teamed with community members of Comuna 8, one such vulnerable hillside district outside of the city center that is made up of several low income formal and informal neighborhoods, to apply local participation methods to urban metabolism. The team focused their data collection and mapping on waste management, material flows to and through households, and citizen perspectives of waste practices in their communities throughout several neighborhoods within Comuna 8, a priority expressed specifically by community leaders.
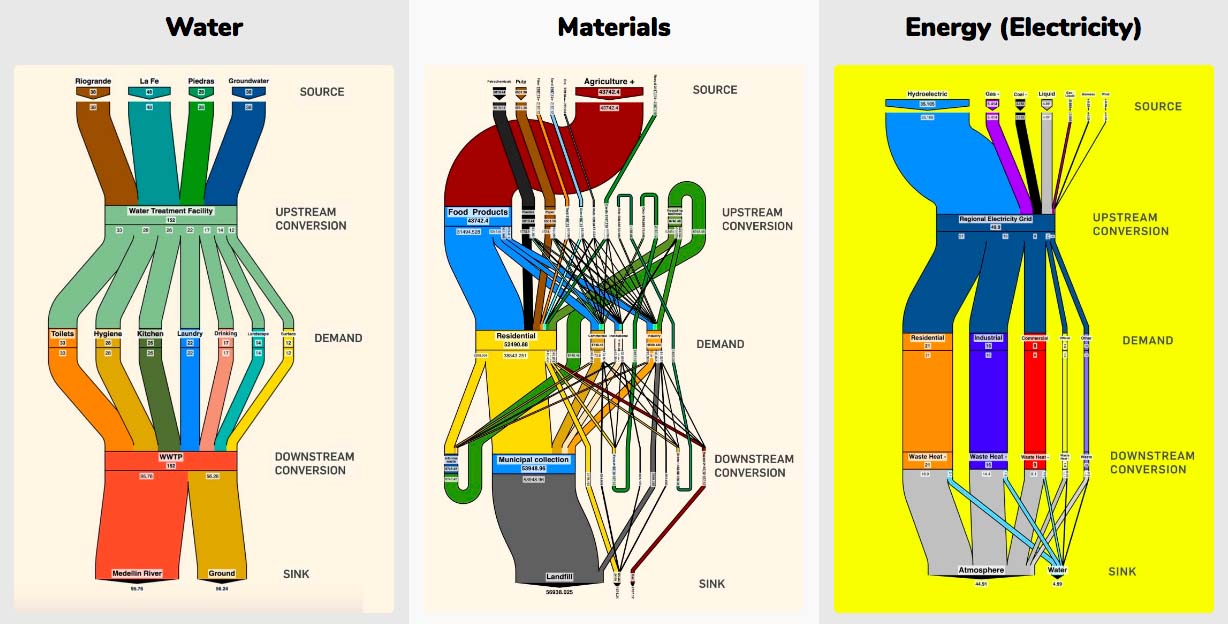
After they collected the data, participants were able to apply their training from the workshops by using Urbinsight’s metaflow app to turn their collective data input into urban metabolic information system flow diagrams. These visualizations proved not only important for researchers to streamline and interpret the household and parcel scale data, but for Comuna 8 residents to understand and improve their own waste stream and for the city to understand the needs of its people.
On recommendation by the planning department, Universidad EAFIT took the lead as the main academic partner, which suggested Boston, a neighborhood characterized as the intended archetype (mixed-income, city center), as the recommended study area. Low Carbon City, a Medellín-based and internationally recognized non-profit organization with strong ties to the Boston community, joined as the community based partner.
https://youtu.be/B0cvcN8yIOM
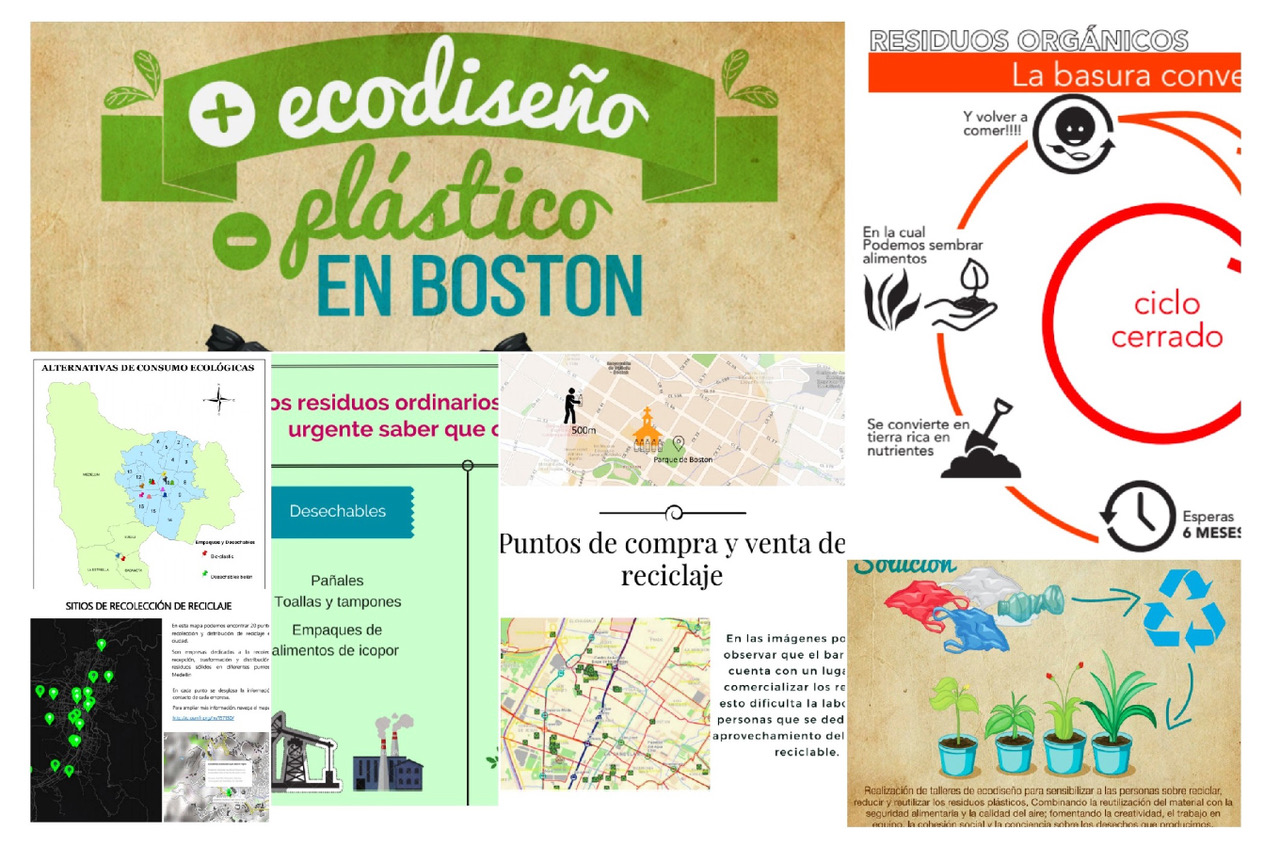
After the data collection activities, participants divided into research teams based on categories of materials that were found to be the most common in the waste stream: plastic, glass, metal, paper, organic, hazardous waste and oils, and mixed waste. Using the field data, they produced reports and presentations on actions that citizens can take to reduce demand, increase efficiency, and reuse/repurpose and recycle materials at home and in the neighborhood in order to decrease waste in public spaces.
During two “mapathons,” participants completed analysis of their waste and materials audits and geoprocessed original data to develop geospatial layers for further analysis and map development. They then worked with the team to integrate municipal data layers with the original neighborhood data layers to produce original maps that they presented to the community members. In a final community event, each group presented interactive participatory educational activities relating to their type of resource topic. They developed posters and short videos to “tell the story” of urban metabolism and the role citizens play in resource cycles.
The project has now entered its next phase during which the partners are once again coming together to create a Sustainable Neighborhood Plan. Building from initial and ongoing urban metabolism assessments, methods and participatory processes, the plan is meant to be adaptable and replicable and is based on Ecocity Builders’ bottom up approach to ecocity development, underscored by Urban Metabolic Information Systems (UMIS) assessments at the neighborhood scale.
Where do we want to go and why?
More sustainable and resilient urban futures can be furthered by using urban metabolism methods and approaches in an ongoing and iterative process. Healthy urban metabolism, just like a healthy ecosystem or an organism, works best when it’s frequently monitored and continuously fine-tuned.
In addition, since it is human beings that are driving the demand for resources that shape a city’s metabolism, it is imperative that citizens are allowed to weigh in and participate in a meaningful way. Getting this kind of first-hand information is not only invaluable because of the previously unknown data points it provides, but because the personal involvement creates new awareness and provides incentive to the community to become engaged in finding solutions to existing problems.
With citizen-generated maps and diagrams based on real-life conditions and structured around a holistic framework, the patterns that emerge allow for both residents and planners to ask the kind of questions that can lead to both local and regional ecological improvements. What could we do for people to get by on rainwater? How could the city avoid leakage in their water and energy systems? How do we create material loops that solve both local waste problems and reduce global carbon emissions? How do we stay within the Earth’s carrying capacity?
Or as Sebastian Moffatt remarks, “we can use these diagrams to tell the story of where we want to go and why!”
Sven Eberlein
Oakland
Header Image: UMIS Vancouver transportation energy footprint.
Leave a Reply